A web application to analyze Oktoberfest data
Back in September 2017, I tried building a Shiny App to analyze Oktoberfest data that are freely availale on the Munich Open Data Portal. My main motivation was to present the Shiny app at the September event of R-Ladies Munich. Unfortunately, my knowledge of shiny was still pretty limited.
At the R-Ladies Munich event
I still decided to present some analysis of the Oktoberfest data, based on a blog post by @gresch. I couldn’t present the shiny app, but I did talk about shiny and how to build a simple web application (something that I could do and show).

Patience, my young padawan
I was very dissapointed, but then I realized that I needed to learn more about shiny before giving up. As part of my new year’s resolutions, I got a one-year subscription at DataCamp. What a game-changer!
I did two shiny courses. The [first one] with Mine Centikaya-Rundel and the second one with Dean Attali. Everything made so much sense! I decided then to give it another try and finish my application just in time to celebrate Open Data Day.
Ein Prosit der Gemütlichkeit!
So, here it is! My OktoberfestR app!
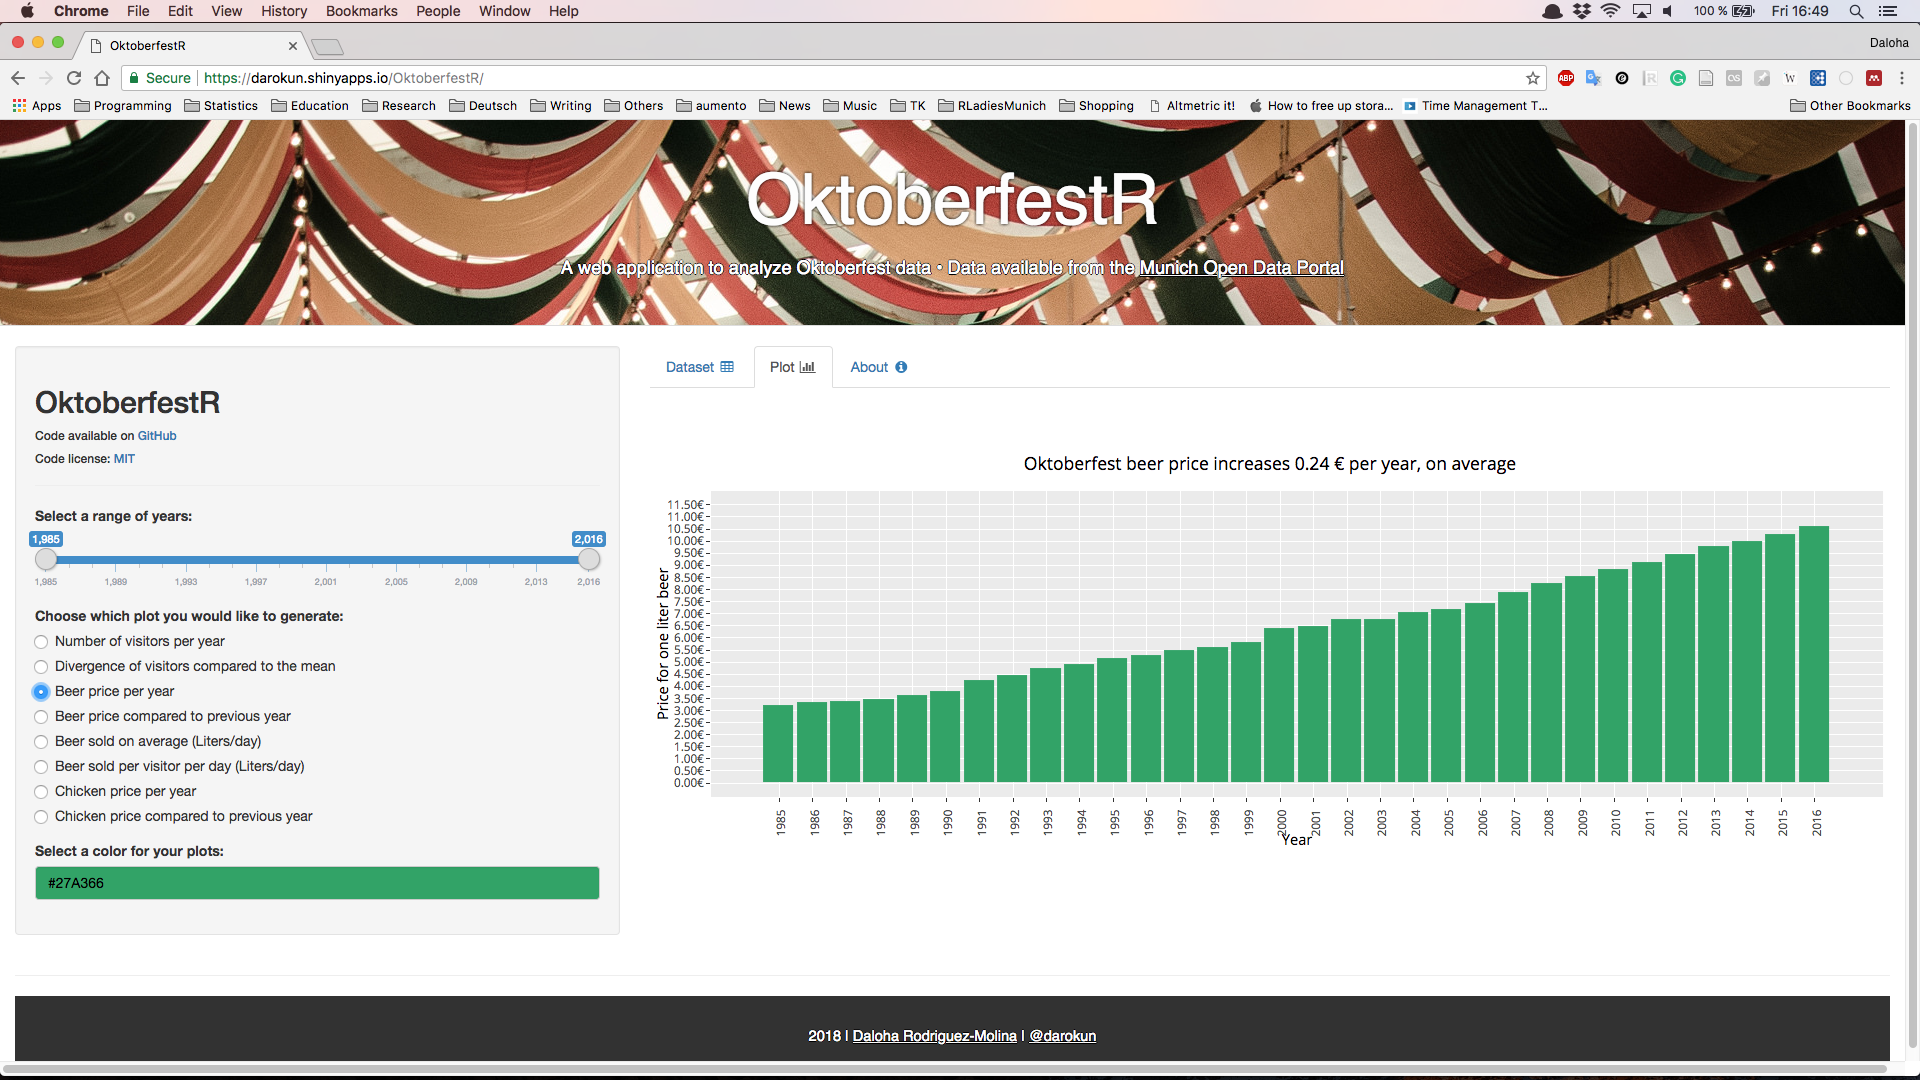
The app takes data from the Oktoberfest since 1985 and until 2016 (so far). It has eight variables:
- The year of the Oktoberfest
- The duration of the festival in days
- Visitors for each year
- Mean visitors per day for each year
- Mean price for one beer (1 Liter) for each year
- Whole amount of beer sold for each year in Liter
- Mean price for one chicken for each year
- Whole amount of chickens sold for each year
The user can interactively make a subset of the data to visualize only a specified range of years, and can then choose from eight different visualizations:
- Number of visitors per year
- Divergence of visitors compared to the mean
- Beer price per year
- Beer price compared to previous year
- Beer sold on average (Liters/day)
- Beer sold per visitor per day (Liters/day)
- Chicken price per year
- Chicken price compared to previous year
Plus, the user can also change the fill color of the bars using the colourpicker() widget for Shiny.